


Why setter analysis is the foundation of volleyball scouting
When analysing your own team or an opponent, one of the most important starting points is always the setter — whether that is your own or the opposition’s. Setter analysis can be approached on three distinct levels, and understanding all three gives you the most complete picture possible.
The three levels of setter distribution analysis
The primary and most important level concerns distribution by game situation: how the setter distributes the ball in positive reception, in negative reception, and in transition (counterattack). Crucially, all of this must always be broken down by rotation, because the setter’s choices will naturally change depending on which hitters are available in each position.
The second level focuses on the net contact point — specifically, where the pass arrives relative to the setter. What choices does the setter make depending on where the ball contacts the net zone? Some setters show clear tendencies based on whether they are pushed close to or away from their preferred setting position.
The third level examines the origin of the reception — from which zone of the court the ball is coming, and how that affects the setter’s decision. A pass coming from zone 1, for example, gives the setter less peripheral vision than a pass arriving from zone 5, where they can see the middle blocker’s approach much more clearly — especially in rotations where the middle is running from position 4 toward position 3.
Analysing setter choices in positive reception
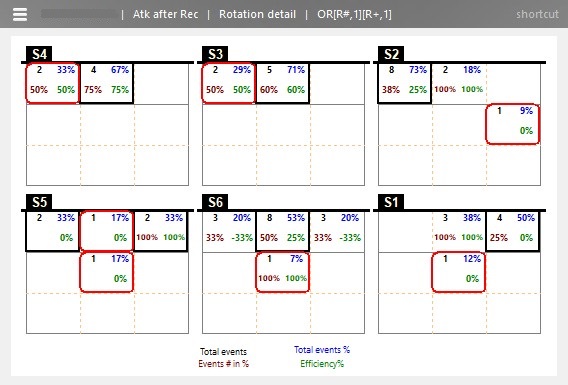
The most important analysis by far is what the setter does when reception is positive — rated as “+” or “++” in Data Volley notation. In these situations, the setter has the full range of options available, making the data far more revealing.
This analysis is most valuable when done rotation by rotation, allowing you to map the setter’s true tendencies when the system is functioning well. To get reliable data, you ideally need a minimum of three matches, and those matches should not all be 3-0 wins, since longer sets produce a larger and more representative sample.
Reading the setter under pressure: negative reception and transition
The second key area is how the setter behaves when reception is imprecise — rated “−” or “!” in Data Volley. Here the key question is whether the setter has a go-to player in these situations, or whether their choices are more influenced by reading the opposing block.
The same logic applies to your own setter: understanding why certain choices are made under pressure opens the door to correcting them in training.
Transition distribution follows similar principles. Does the setter have one or two preferred hitters in counterattack? Are those preferences consistent, or do they shift during critical phases of the set — for example, from 16 onwards or from 20 onwards? Tracking score-phase tendencies can reveal patterns that are invisible when looking at aggregate data alone.
Setter decisions by net contact point
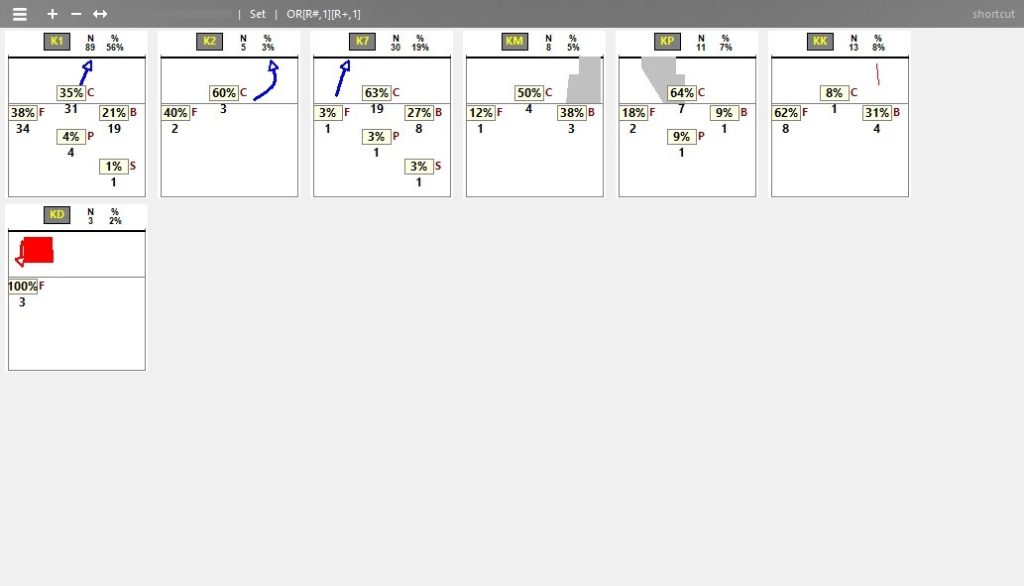
Analysing distribution by net contact point helps you understand whether a setter tends to play away from themselves or consistently returns to a preferred hitter regardless of where the pass arrives.
A practical example: on a pass that drifts toward zone 2, does the setter open out to zone 4, or do they play back to 2, to 1, or run the quick set? The same question applies in reverse on passes drifting toward zone 4. On tight or broken passes rated “!”, the inability to run a quick set changes the picture further — does the setter go to 4, open to 2, or redirect to zone 1?
Using reception origin to complete the picture
While less decisive than the other two levels, the origin of the reception can provide meaningful support when working with a large enough dataset. For example, in rotations P1 and P5, some setters show measurably more difficulty running quick sets when the pass comes from zone 1, compared to passes from zone 5 where they have a clearer view of the middle’s approach. On a high volume of data, this kind of pattern becomes statistically visible.
Building the complete setter profile
All three levels — game situation, net contact point, and reception origin — intersect to create a full profile of the setter’s decision-making. This statistical picture should always be supported by video, which reveals the technical qualities and individual habits that numbers alone cannot capture.
Tools for setter analysis: from Data Volley to practical alternatives
The most advanced tool for this type of work is Data Volley, which allows you to cross-reference all three analytical levels simultaneously with just a few commands. For instance: in rotation P1, on a perfect pass from zone 5, with the ball drifting toward zone 2 — what does the setter choose? Data Volley answers that question instantly, provided you have enough data (at minimum five matches is recommended for this level of detail).
More accessible tools can also be used, though the analysis will take considerably longer and the cross-referencing capabilities will be more limited. The core framework, however, remains exactly the same regardless of the tool.